

An Evidence-Based Diagnosis for Your IT Operations.
No guessing. Only analysis. AI-assisted pattern detection identifies exactly where value is leaking—without touching live servers or disrupting operational teams.
The Process
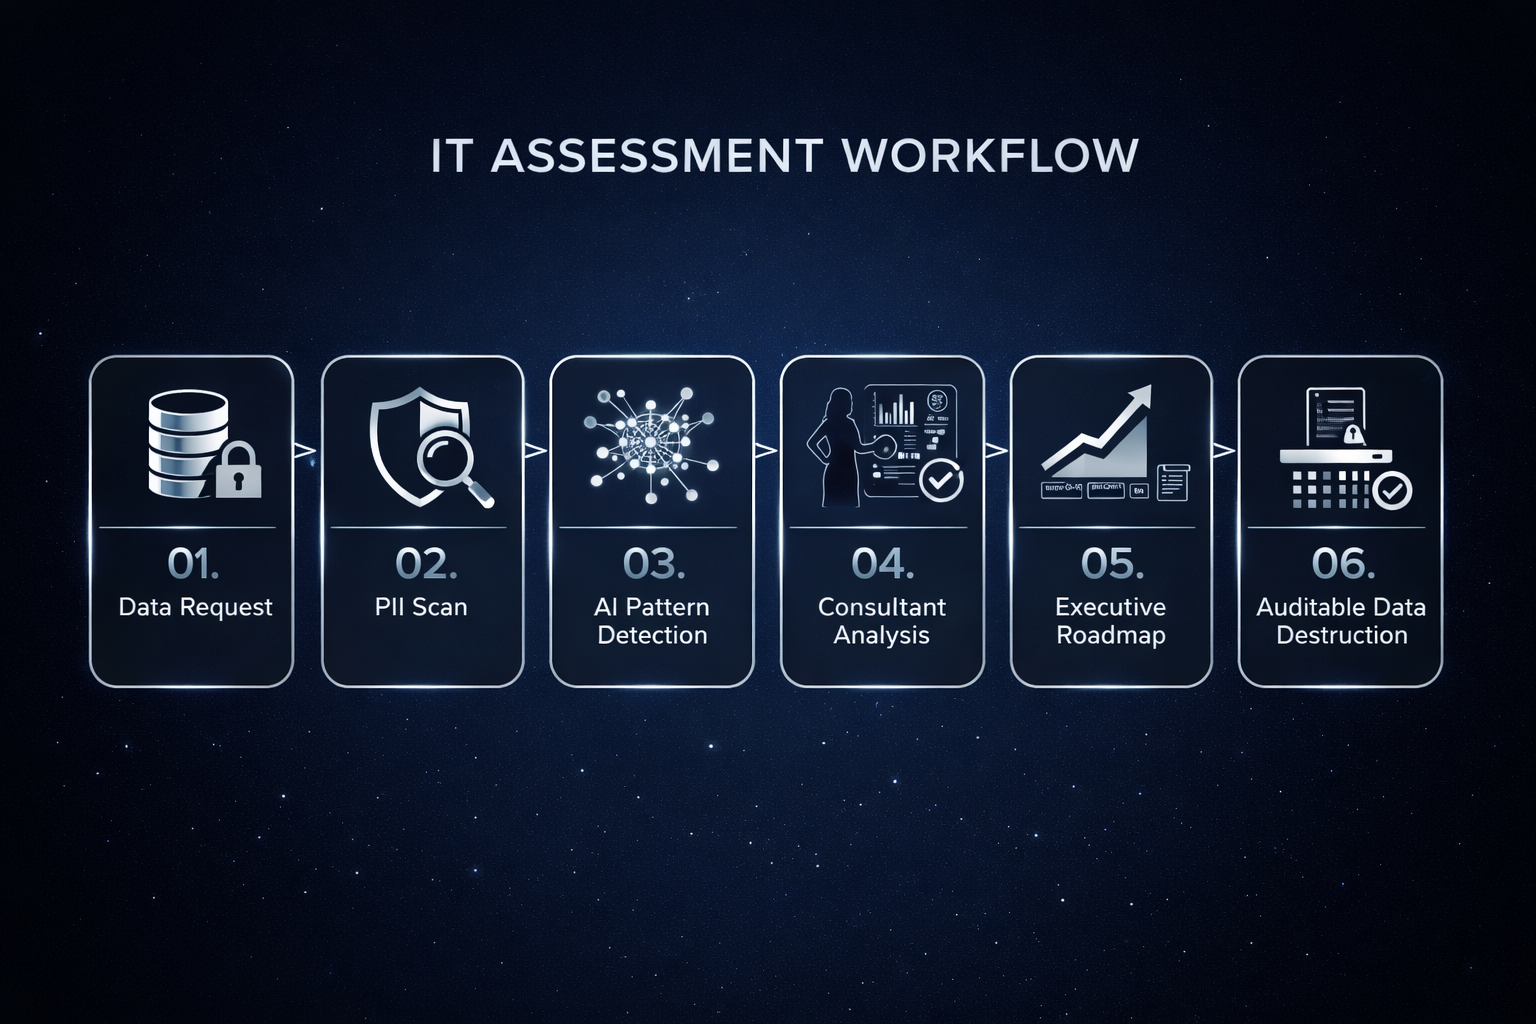
01. Data Request:
A strict "minimum data needed" rule is applied. Specific operational narratives and service catalogue definitions are requested. Access to production servers is never required
02. PII Scan:
Before analysis begins, a dedicated Privacy Scan identifies and neutralizes Personal Identifiable Information (PII). Any residual names, emails, or phone numbers are redacted or pseudonymized
03. AI Pattern Detection:
AI accelerates the analysis of large volumes of operational text to surface recurring failure patterns and hidden risks not visible through standard metrics.
04. Consultant Analysis:
All findings and scores are human-reviewed by the Principal Consultant to expose the operating reality—identifying exactly where instability, escalation, or cost is being created.
05. Executive Roadmap:
Leadership receives a package based on the tier level, designed to translate findings into immediate, manageable action
06. Project Closure:
The engagement concludes with a 30-day retention window, followed by the permanent, auditable deletion of all raw logs, datasets, and intermediate models.
Assessment Tiers
Choose the Right Depth
Three tiers. Same evidence-led framework. Different depth and decision power.
-
Purpose
Rapid executive-level visibility into service delivery risk and obvious hotspots — with minimal client effort.Best for
A quick “are we at risk?” view across 1–3 business-critical services, before budgeting or challenging “green” reporting.Typical timeline
10–14 days (remote)What you get
1-page executive scorecard (3 scored domains + qualitative notes on 2)
Top risk hotspots + recurring themes (with concrete examples)
Fix / Watch / Ignore recommendations (high-confidence actions only)
Lightweight evidence log (what each finding is based on)
Minimum data (typical)
Incident log (last 6–9 months)
Service catalogue + service ownership (current)
Optional: change log (3–6 months), service review packs, high-level SLA/target definitions
-
Purpose
Identify root causes behind recurring escalations, instability, and vendor friction — and produce a decision-ready 90-day improvement roadmap.Best for
When leadership needs root causes + what to do next, without launching a full transformation programme.Typical timeline
~4 weeks (remote)What you get
Executive health scorecard with overall Health Score (1–5) + risk band
Evidence repository (finding → evidence → “so what”)
Quantitative diagnostics (recurrence, reopen patterns, change failure signals, handover “hops”, major incident duration drivers)
Root-cause themes + control gaps (documented process vs operating reality)
Prioritised 90-day roadmap (0–30 / 31–60 / 61–90) with owners at role/group level
Minimum data (typical)
Incident + Problem + Change logs (12 months+; problems often 12–24 months)
Service catalogue + ownership
Major incident register / bridge timelines (where applicable)
Operating model artefacts (RACI, role-based org chart, process maps)
Vendor/SLA targets + last 3–6 months of service review packs
-
Purpose
Decision-grade assessment for major structural change — including scenario options and readiness analysis.Best for
Outsourcing/insourcing, scaling, tool/process overhaul, mergers, or operating model change — when the wrong move is expensive.Typical timeline
6–10 weeksWhat you get
Expanded scorecard + deep diagnostic report
Readiness assessment (people / process / vendor / governance / data controls) with gaps + prerequisites
Scenario + risk analysis (2–3 realistic options with trade-offs, critical path, and likely failure modes)
Executive decision pack (what to approve / defer / stop)
12-month plan + initial 90-day tranche
Full evidence repository with traceability from conclusion back to data
Minimum data (typical)
Extended data window (often 12–24 months) across incidents / problems / changes / major incidents
Availability + “perceived outage” metrics (where available)
Full operating model + governance artefacts
Vendor strategy + contract/SLA structures
Compare tiers at a glance
| Category | Tier 1 — Baseline | Tier 2 — Core Most Popular | Tier 3 — Deep |
|---|---|---|---|
| Overview | |||
| Typical timeline | 10–14 days | ~4 weeks | 6–10 weeks |
| Best for | Fast risk visibility | Root causes + 90-day plan | Scenarios + readiness |
| Scope depth | Directional hotspots | Full health check | Decision-grade diagnostic |
| Stakeholder interviews | 1–2 (optional) | 3–5 interviews | 5–10+ interviews |
| On-site option | 1–2 days | 2–4 days | 5–8 days |
| Data | |||
| Data window | 6–9 months | 12 months | 12–24 months |
| Core datasets | Incidents + Service Requests + Change + Catalogue | All Tier 1 + Problems + MI + Process & Governance Artefacts | All Tier 2 + Availability/Outage + CI Governance |
| Outputs | |||
| Primary outputs | Scorecard + Fix/Watch/Ignore | Evidence repo + 90-day roadmap | Decision pack + 12-month plan |
| Evidence traceability | Light | Full repository | Full traceability |
| Scored health domains | 3 of 5 (qualitative notes on 2) | All 5 domains | All 5 + readiness dimensions |
| Advanced | |||
| Readiness assessment | — | — | Included |
| Scenario analysis | — | — | Included |
Minimum data required
Most clients can export this in 1–3 hours.
Incidents Records (required)
Service Requests (required)
Service catalogue + ownership (required)
Change Records (required)
Problem Records (Tier 2/3)
Major Incidents/bridge timeline (Tier 2/3)
Vendor SLA targets + service review packs (Tier 2/3)
Availability / perceived outage (Tier 3)
Privacy & Controls (applies to all tiers)
Data minimisation: personal data not required for diagnostic outcomes
Free-text sanitisation recommended; residual scan + quarantine for anything suspicious
AI is gated: analysis runs only after validation; quarantine pauses processing
Evidence traceability: every finding ties back to data
Retention: data deleted within 30 days after the final report (unless agreed otherwise)
No employee performance assessment — this is about system/control failure modes
FAQ
Straight answers to the questions people actually ask before sharing operational data.
-
No. The assessment is designed around operational signals (volumes, timestamps, categories, outcomes, recurrence). We recommend sanitising free-text before sharing. If anything suspicious appears, it’s quarantined and excluded from AI analysis.
-
Only after data is validated and privacy controls are applied. AI is used to accelerate pattern detection (hotspots, recurring failure modes, anomalies). Final conclusions are consultant-validated and linked back to evidence.
-
Anything that can export structured logs. Common sources include ServiceNow, Jira Service Management, Freshservice, BMC, and similar tools. If you can export incidents/changes/problems and service ownership, you’re good.
-
You get decision-grade outputs, not a vague maturity score:
An executive scorecard (overall health + domain scores)
The key failure themes and hotspots (with supporting evidence)
A prioritised roadmap (Tier 2 includes a 90-day plan; Tier 3 extends to scenarios/readiness and a longer horizon)
-
We scope to what’s available and tell you what confidence you can expect. Tier 1 works with a minimal dataset. Tier 2/3 benefits from problems/changes/MI and governance artefacts, but we can phase the analysis.
-
Low. Most effort is exporting data and confirming service ownership. Tier 2/3 typically includes a small number of interviews/workshops to validate findings and ensure the roadmap is implementable.
-
No. This is about system and operating-model failure modes (process reality, handoffs, governance, vendor dynamics, signal quality). We don’t do individual performance assessment.
-
Data is retained only as long as necessary to complete the assessment and produce the deliverables, then deleted within the agreed retention window (your current model: within 30 days after final report, unless explicitly agreed otherwise).